
More on Anomaly Detection at Tech In Deep
A lot of applications require the ability to detect whether a new observation belongs to the same distribution as the existing observations. The application we are building now detects the opposite. Anomaly Detection is a filed interested in detecting abnormal or unusual observations.
Suppose you are a credit card holder. And on unfortunate day your card got stolen. Payment Processor Companies (like PayPal or Payoneer) do keep a track of your usage pattern. If a dramatic change in your usage pattern happens, you will be notified.
Outlier detection (also known as anomaly detection) is the process of finding data objects with behaviors that are very different from expectation. Such objects are called outliers or anomalies.
Data Mining. Concepts and Techniques by Han et al.
Workflow for Anomaly Detection:
- Generate a signal/data that would represent what is “normal” in our dataset
- Train our classifier on those “normal” features represented in our dataset
- Generate a Window Function to reconstruct the original signal/data
- Calculate the error/distance between the reconstructed signal and the one we are analyzing at the moment
- Detect anomaly in data represented by a spike in the error function
Introduction in Anomaly Detection
In our project we are going to observe a waveform for a period of time. The waveform will have some kind of a regular shape. The regular shape indicates some sort of a normal behavior. A deviation from this pattern may indicate that something funny is going on.
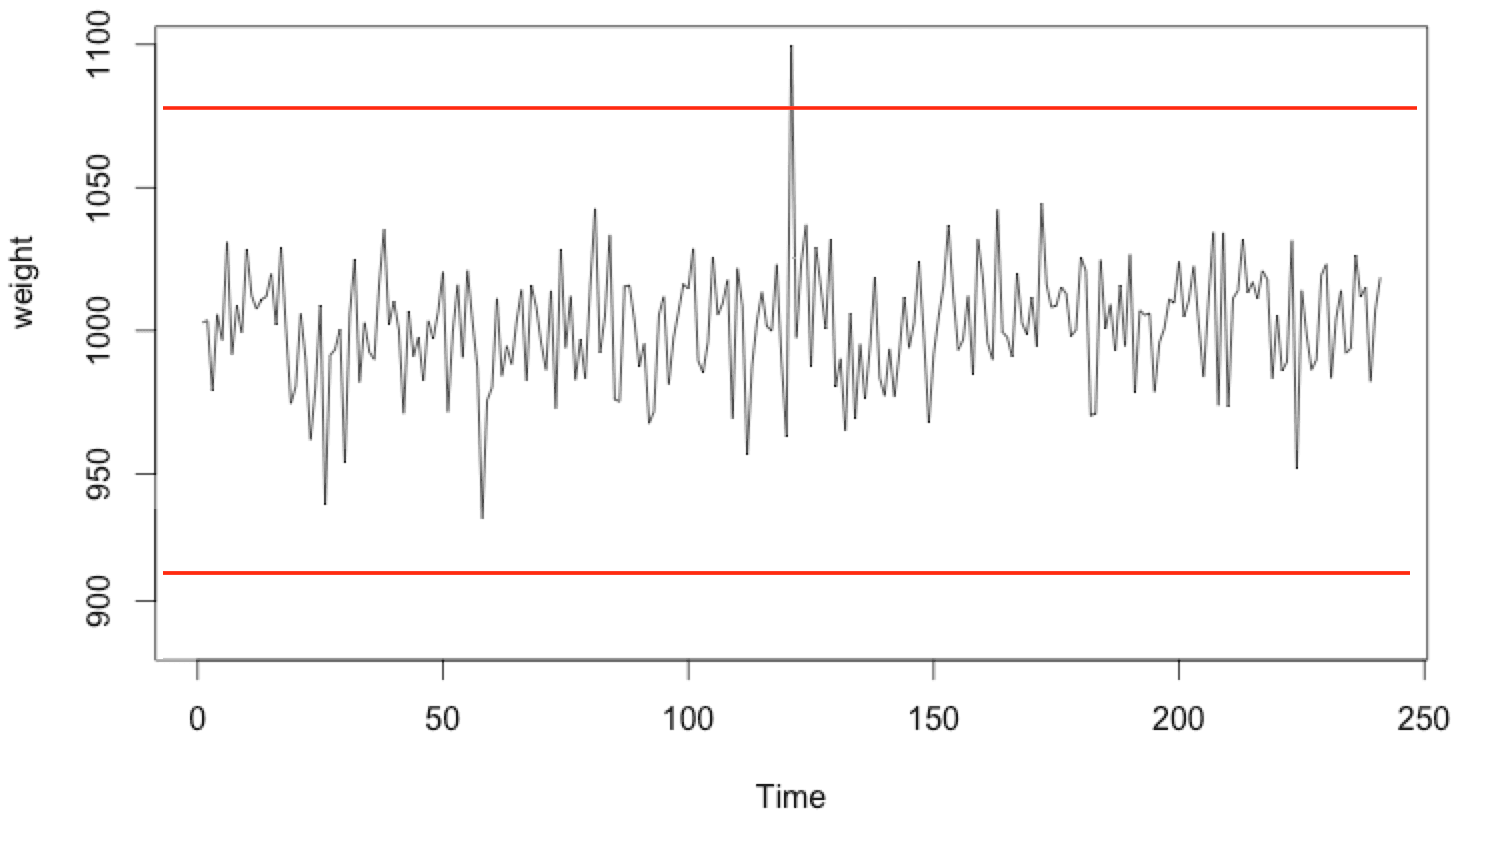
The waveform we are about to analyze is the CPU usage over time.
The image above shows a recorded 60 second CPU workload waveform. This is what we will call a “normal” signal. Signals outside of this waveform with abnormal peaks, will be considered as anomaly.
Detecting anomalies is pretty useful in a lot of scenarios. As a matter of a fact, this application can detect abnormal CPU usage. Now this is just a very basic example. Because of that, we can set a fixed threshold. If the CPU usage is above that threshold, we can state that anomaly is detected.
Sometimes the changes in the data structure are more subtle. Therefore, fixed threshold might not work. A better approach, is to build a solution that can learn what a normal CPU workload looks like.
Why solve Anomaly Detection problem with K-Means
The problem we are looking at right now, is very simple. It has only two dimensions. Imagine application which will also measure other variables as well, like RAM memory consumption, GPU usage, Disk usage and Network usage. Suddenly we are dealing with more than 2 variables. Setting a fixed threshold for n-dimension problem can be a bit tricky. That is why we will use K-Means.
Because K-Means can detect patterns in n-dimensional space, the algorithm will have no problem to generalize to more complex situation.
And the second reason on why to solve Anomaly Detection with K-Means, is because we might want to look at the shape of the waveform over a period of time as well, and not only the magnitude.
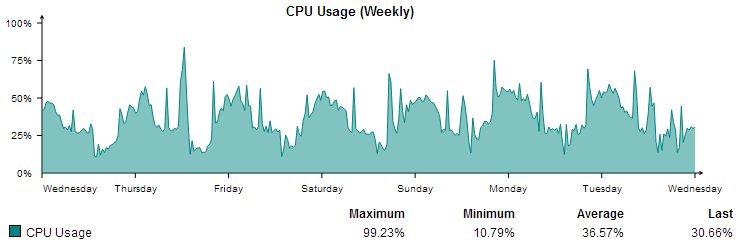
In this image we have the weekly CPU usage waveform. As you can see there is a repeating pattern that we can spot. And instead of hunting down the highest peak, we might want to look at the abnormal pattern shapes that we can see on the image, recurring on a daily basis.
Anomaly Detection Project Description
As you can already tell we are going to detect abnormal CPU usage. The application will measure the normal CPU workload for a period of 60 seconds, extract waveform segments and train the K-Means classifier to recognize what is a normal waveform. Everything outside the training dataset will be considered as anomaly.
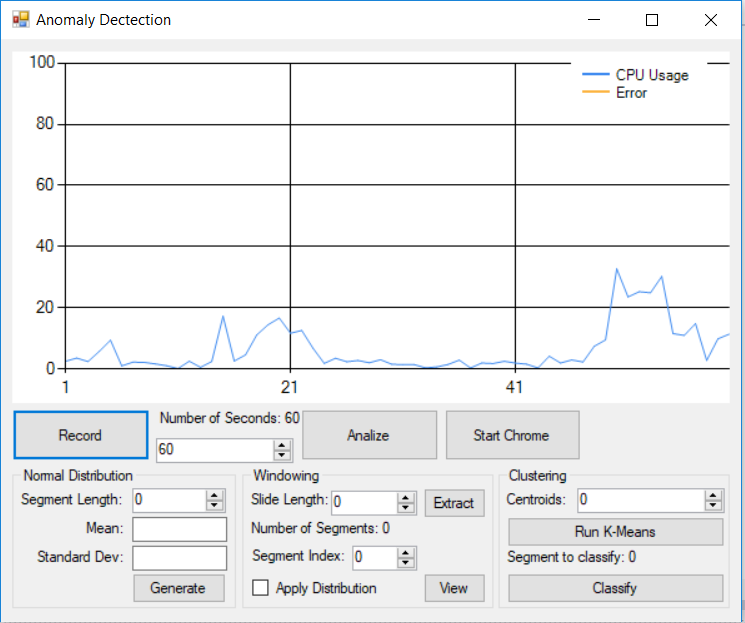
PerformanceCounter in .NET
PerformanceCounter class will be used to generate the CPU waveform.
PerformanceCounter cpuPerformanceCounter;
cpuPerformanceCounter = new PerformanceCounter("Processor", "% Processor Time", "_Total");
Timer component will use the PerformanceCounter object to add a CPU workload value.
Windowing
The first step in our process is to split the waveform into overlapping segments, with the section of the original data sampled sliding along by two samples each time. We take this approach so that we get instances of each waveform shape with a variety of horizontal translations.
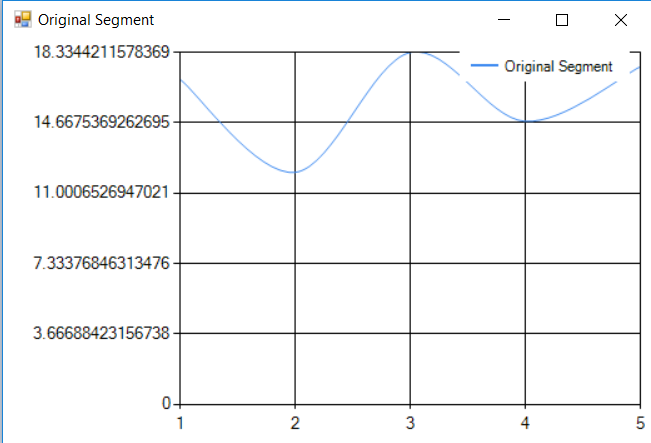
Following is an image from the first extracted segment from the CPU workload waveform.
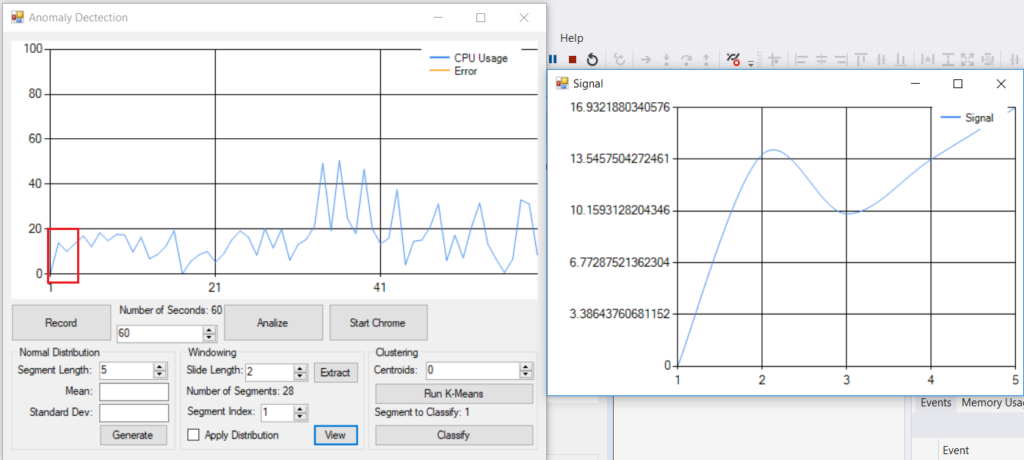
From the application configuration it is clearly visible that the application has recorded the CPU workload for 60 seconds. The window segment is 5 seconds long and there is 2 second overlap.
The Window Function
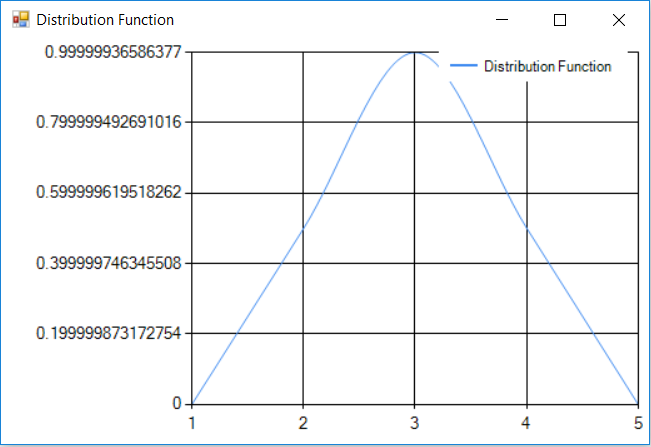
Since a normal CPU waveform segment can start and end with a non-zero values, we may end up with discontinuities. Because of that we apply the window function on the CPU segment waveform.
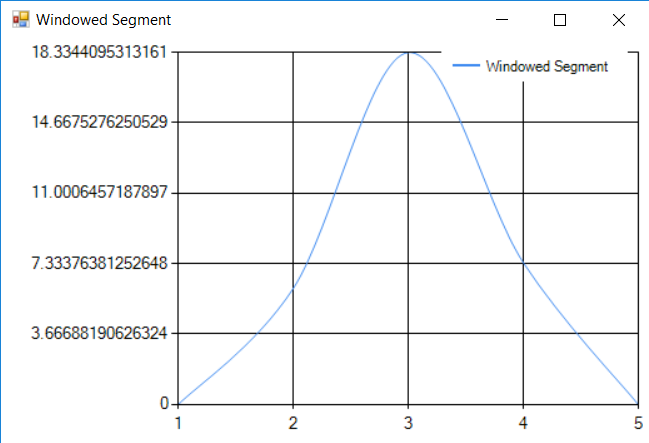
Let’s look at the following signal
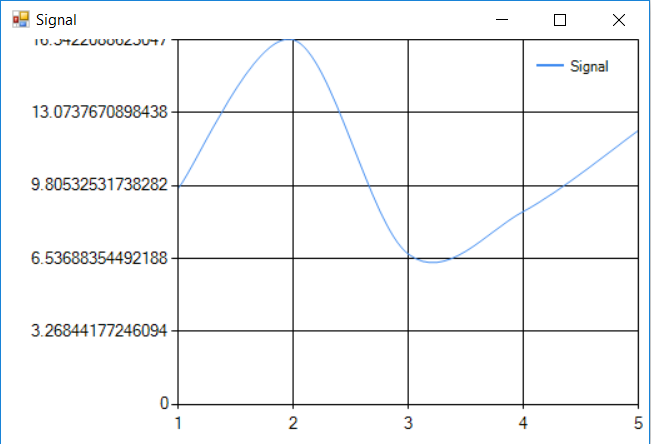
It is clear that the signal starts and ends with a non-zero value. In order to deal with that problem, the Window Function is applied and the following waveform is obtained:
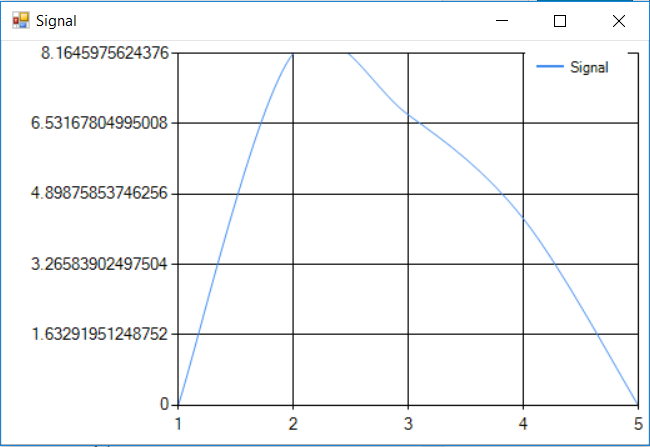
This way we are solving the problem with non-zero values.
K-Means Clustering
Now it is time to train the K-Means algorithm to recognize normal segment patterns in the CPU workload waveform.
The input in the K-Means algorithm is 5 second segments from the CPU waveform but with the Window Function applied to them.
If you are not familiar with K-Means, take a look at my other posts and projects on the topic:
- How K-Means works – take a look at this project in order to see how K-Means algorithm works visually in 2D space
- K-Means Elbow Method – if you are not sure how many centroids are there in the dataset, check out this project to see how to find out the correct number.
- Shape Recognition with K-Means – will show you how to apply K-Means to a share recognition problem
After the training K-Means is ready to recognize “normal” CPU workload pattern.
Workflow:
- Obtain segmented CPU workload waveform
- Apply the Window Function on that segment
- Pass the windowed segment to the K-Means Classifier to get the nearest centroid
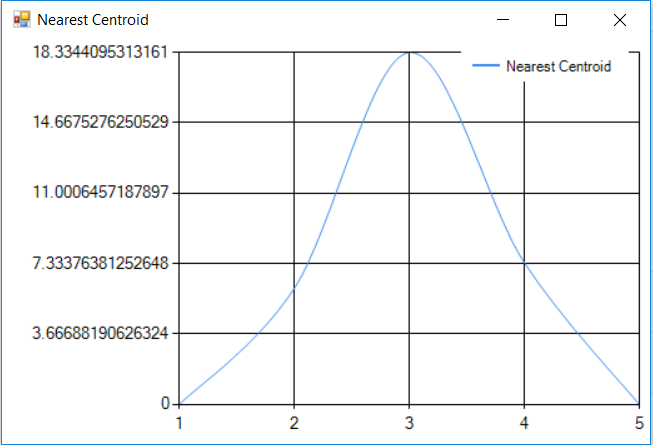
The difference between the K-Means nearest centroid and the windowed segment is zero. Therefore, K-Means did a good job at predicting.
The idea is to try and reconstruct the original signal that came from the CPU workload waveform. If the reconstructed waveform is close to the original one, the error will be close to zero.
If there is a segment that is abnormal – (not in the training set), K-Means will make a poor prediction on it. Thus the error on that part of the waveform will be detected easily.
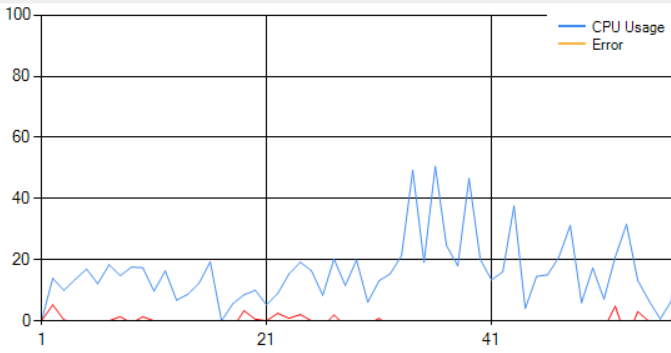
Analyze the normal CPU workload waveform
After analyzing the original CPU workload waveform, we can see that the error is pretty low.
- Blue Line represents the CPU usage workload waveform
- Red Line is the error calculated by subtracting the Original CPU waveform from the predicted one made by K-Means
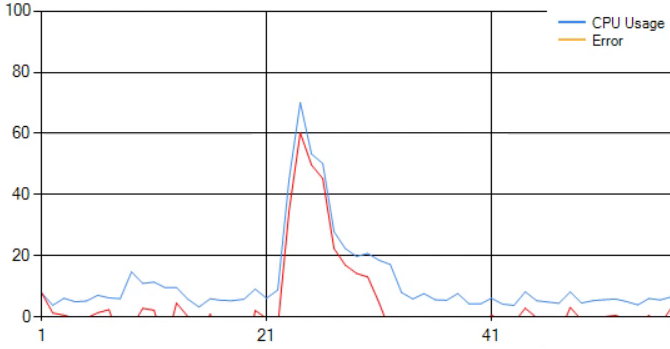
Abnormal CPU Usage Waveform
When K-Means is unable to reconstruct a given CPU waveform segment well, the error increases. This is because K-Means can not recognize this segment as part of the training data it was provided. It tries to reconstruct the segment as close as possible, but since this is really different than what it knows, the error is obvious, thus we can consider this segment as anomaly.
ubaTaeCJ
March 12, 2024 at 9:40 pm555
8I7d9lDP
March 12, 2024 at 9:42 pm555
ubaTaeCJ
March 12, 2024 at 9:42 pm1*555
ubaTaeCJ
March 12, 2024 at 9:43 pm555
ecommerce
April 15, 2024 at 10:25 pmWow, incredible weblog layout! How lengthy have you ever been running a blog for?
you make running a blog glance easy. The overall
look of your web site is great, as neatly as the content material!
You can see similar here sklep internetowy